Started during a college group project that scored 94.8% accuracy, I suspected our model was cheating. Post-deadline, I launched an independent audit, exposed a speaker-overlap data leak, and rebuilt the entire machine learning pipeline to find the honest clinical truth.
As a college group project, and not a serious one.
We needed a submission and a number to put on it. Parkinson's from voice recordings is a well-worn dataset, the pipeline is a weekend of work, and ours returned 94.87% accuracy. That was the goal at the time: something that ran, something that scored, marks on the board. Nobody on the team, me included, asked the obvious question.
The question arrived a few weeks after the deadline, when the marks no longer mattered and the number would not leave me alone. 94.87% at detecting a neurological disease from a few seconds of a held vowel, from a laptop, on a dataset of 195 recordings. Either this was a solved problem that had somehow escaped the medical community, or I had measured something other than what I thought.
I had. This page is what happened when I went back and found out, alone, with nothing riding on the answer.
Detect Parkinson's disease from a voice sample, and be able to say why.
Parkinson's reaches the voice early. Before a tremor is obvious, the muscles that control the larynx lose some of their steadiness, and that shows up in a held vowel as pitch that wanders and loudness that will not sit still. A person holding "aaah" for a few seconds is therefore a genuine signal, and it costs nothing to collect: no scan, no blood draw, no clinic.
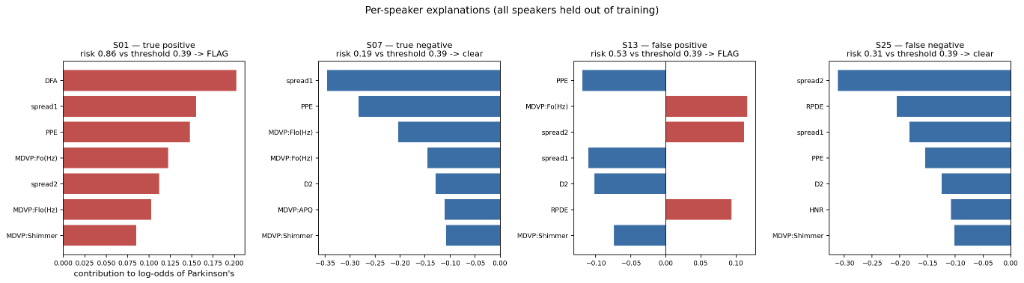
So the build has two halves, and the second is the one that matters. First, a classifier over 22 acoustic measures of that recording, trained to separate speakers with Parkinson's from those without. Second, an explanation for every call it makes, through SHAP for the global picture of which measures carry the decision and LIME for the local one of why this speaker was flagged. A screening score nobody can interrogate is not usable in a clinic, and a number without a reason is not evidence. Getting the model to justify itself was the point of the project, not an extra on the end of it.
Which is exactly how the real finding surfaced. To trust an explanation you first have to trust the score underneath it, and that is where this stopped being a straightforward detection project.
My first pass at this reported 94.87% accuracy. The number was real and the code was correct. The result was still wrong.
The UCI Parkinsons dataset holds 195 sustained-vowel recordings, and it is tempting to treat those as 195 patients. They are not. They are 32 speakers with six or seven recordings each, and every speaker carries one diagnosis across all of their recordings. A row-wise train/test split therefore puts the same voice on both sides of the boundary. The model does not have to learn a disease. It can learn a voice.
So this rebuild asked a different question. Not "how accurately can I classify Parkinson's from voice," but "how much of the usual answer is leakage, and what does removing it cost?"
Protocol. Every evaluation is nested cross-validation grouped by speaker, so no speaker ever appears in both a training and a test fold. The screening estimates come from 40 outer folds.
Feature reduction. Six of the 22 features were dropped for near-perfect collinearity before any modelling: MDVP:RAP and Jitter:DDP correlate with MDVP:Jitter(%) at r = 0.990, and MDVP:Shimmer(dB), Shimmer:APQ3, Shimmer:APQ5 and Shimmer:DDA all correlate with MDVP:Shimmer above r = 0.98. That leaves 16 features carrying independent signal.
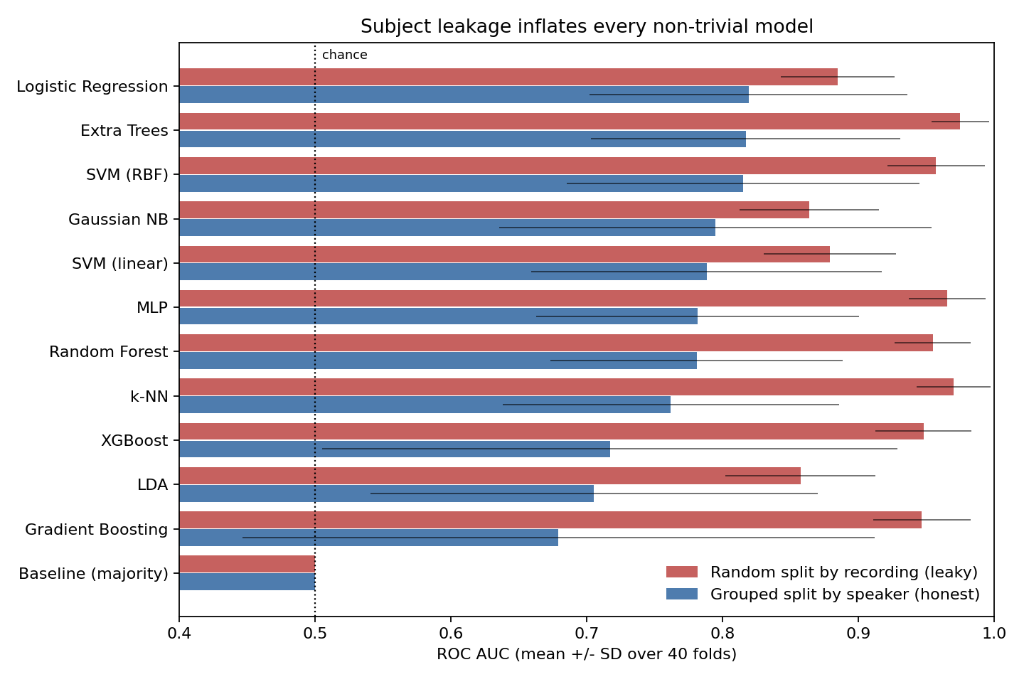
The measurement. Twelve models, trained twice each, across 40 outer folds under both protocols. 960 runs. Once record-wise, the leaky way, and once speaker-wise, the honest way, so the gap between them could be quantified instead of assumed.
| Metric | Mean optimism | Worst offender |
|---|---|---|
| ROC AUC | +0.159 | Gradient Boosting, +0.267 |
| Balanced accuracy | +0.163 | k-NN, +0.236 |
| Accuracy | +0.110 | SVM (RBF), +0.206 |
A published-looking 0.95 AUC on this dataset is plausibly a 0.79 AUC with a leak attached.
The leak does not just inflate scores. It changes which model wins.
The model ordering under leakage is statistically indistinguishable from noise relative to the honest ordering. So a team that benchmarks six models with a row-wise split is not merely reporting a number that is too high. They are selecting the wrong architecture, then tuning it, then shipping it. The plain linear model that wins honestly would have been discarded in round one.
Logistic Regression, threshold calibrated to a 0.90 sensitivity target (threshold 0.394, sd 0.046):
| Recording level | Speaker level | |
|---|---|---|
| Sensitivity | 0.897 | 0.921 |
| Specificity | 0.483 | 0.488 |
| PPV | 0.842 | 0.844 |
| NPV | 0.608 | 0.677 |
| ROC AUC | 0.834 | 0.852 |
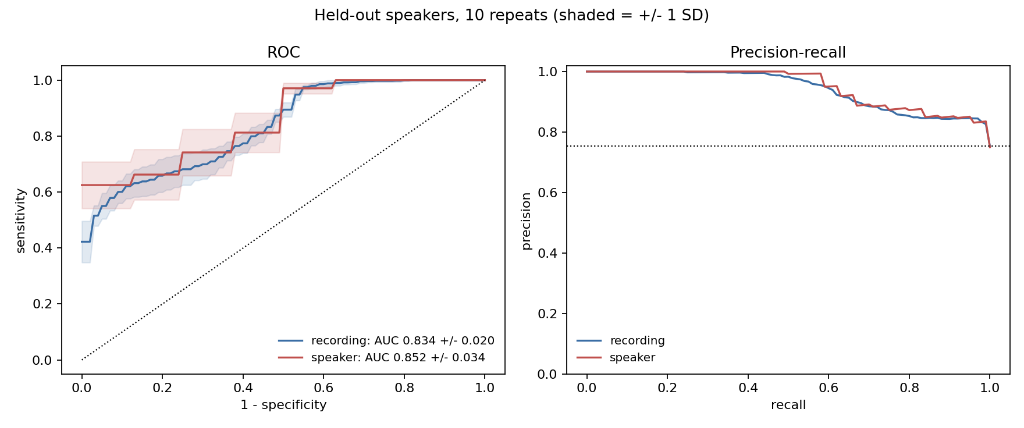
Specificity near 0.49 is the honest cost of a screening threshold. Roughly half of healthy speakers get flagged for follow-up. For a first-line screen that is a defensible trade, because a missed case costs the patient their early intervention window while a false alarm costs one appointment. It is only defensible if you say it out loud.
Calibration: Brier score 0.165, mean predicted risk 0.578 against an observed prevalence of 0.754. The model is systematically under-confident, which is worth stating rather than hiding.
Two independent findings from the explainability work, both inconvenient, both kept:
SHAP and permutation importance do not agree. Spearman between the two rankings is -0.165. SHAP's top features are spread1, PPE and MDVP:Fhi(Hz); permutation importance prefers spread2, MDVP:APQ and MDVP:Fhi(Hz). Only one feature appears in both top three.
SHAP rankings are only moderately stable. Across 12 folds, mean pairwise Spearman between SHAP orderings is 0.542, and the worst pair is -0.215. A feature-importance chart from a single fit is not a finding, it is one sample.
spread1 and PPE survive both tests, ranking first and second by mean absolute SHAP with the tightest rank variance. Those two I would defend. The rest of the ranking I would not.
| Feature | What it measures | Direction | Cohen's d | Single-feature AUC |
|---|---|---|---|---|
spread1 | Pitch variation | Higher in PD | 2.033 | 0.927 |
PPE | Pitch-period entropy | Higher in PD | 1.910 | 0.922 |
spread2 | Pitch variation | Higher in PD | 1.459 | 0.859 |
MDVP:Shimmer | Loudness instability | Higher in PD | 1.235 | 0.828 |
MDVP:APQ | Amplitude perturbation | Higher in PD | 1.220 | 0.875 |
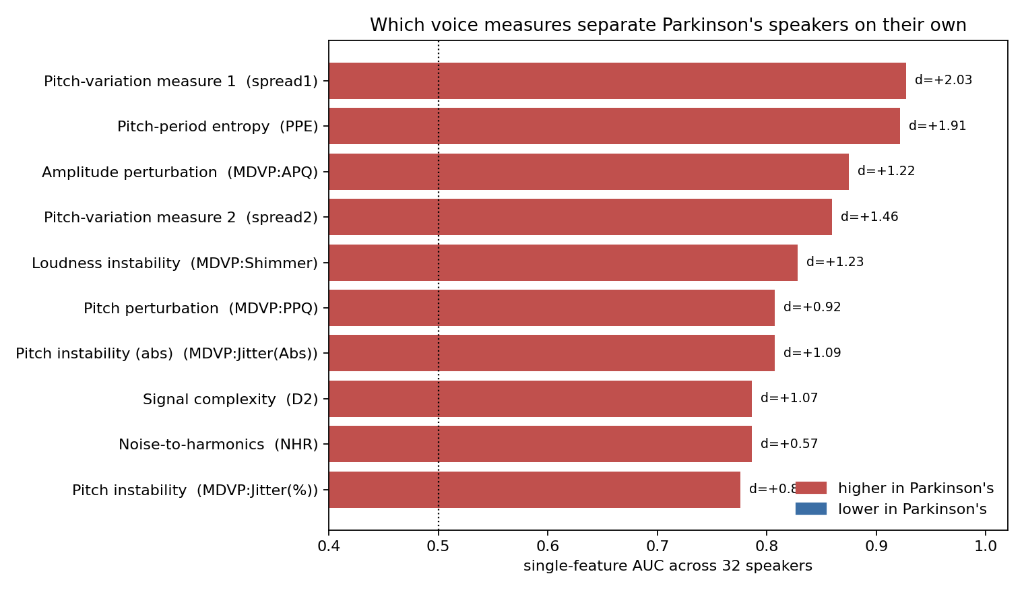
spread1 alone reaches 0.927 AUC. The full 16-feature model reaches 0.852 under an honest protocol.
Two readings of that, and both are worth stating.
The useful one: the model collapses to a two-measure screening test. spread1 and PPE are the only features that survive both the SHAP stability check and the permutation cross-check, and they are the two strongest univariate separators at Cohen's d of 2.03 and 1.91. A screen built on those two holds 92% sensitivity at the speaker level. Fourteen of the sixteen features are, for screening purposes, decoration.
The cautious one: single-feature AUC is computed across the whole dataset without a grouped split, so 0.927 carries the same optimism this whole study exists to measure. It is not directly comparable to the 0.852 that came out of speaker-wise folds. The honest comparison would recompute it inside the same protocol, which I have not done yet, and until I do the two numbers do not belong in the same sentence.
Imagine a teacher giving a student the exact exam questions the night before. If the student gets 100%, are they a genius, or did they just memorize the answers? Our AI originally "memorized" what patients sounded like instead of learning what Parkinson's sounded like, which artificially boosted its score.
A grading scale from 50% to 100%. 50% means the AI is just guessing (like flipping a coin). 100% means it never makes a mistake. It helps us see how good the AI actually is at telling sick and healthy people apart.
Normally, AI is a "black box" - it gives an answer but won't tell you how it got there. These tools act like a math teacher forcing the AI to "show its work." For this project, they forced the AI to point to the exact vocal fluctuation in the recording that made it suspect Parkinson's.
Just like a doctor checks your temperature and heart rate to check for a fever, the AI looks at "features" in a voice - like tiny changes in pitch or loudness - to check for disease.